
Comparing growth rates of revenues and costs involves analyzing all company costs and key profit indicators as a percentage of sales (or production for companies with significant fluctuations in their inventories of finished goods and work in progress). This analysis aims to avoid assuming that past earnings growth will continue unchanged into the future. Just because profits grew by 30% annually for two years due to various factors, it does not guarantee that this growth rate will persist. Earnings and sales may not grow at the same pace due to factors such as structural changes in production, the scissors effect, and cyclical effects accentuated by the company’s cost structure.
1. OPERATING LEVERAGE
Breakeven point
Operating leverage links variations in activity (measured by sales) with changes in results (either operating profit or net income) and depends on the level and nature of the breakeven point. Breakeven is the level of activity at which total revenue covers total costs, resulting in zero earnings. If the company does not reach breakeven due to insufficient sales, it posts losses. If sales are exactly equal to the breakeven point, profits are zero. Exceeding the breakeven point generates a profit. Calculating the breakeven point requires dividing costs into fixed and variable categories, which depends on the period under consideration. In the long term, all costs are variable, while in the very short term (less than three months), almost all costs are fixed except certain direct costs. From a medium-term perspective, certain costs, like indirect personnel costs, can be considered variable. The breakeven point is not absolute and decreases as the period under consideration increases. It is crucial to define which type of breakeven point is needed before calculation. This step is often overlooked. For instance, we may want to assess the projected change in the company’s earnings in the event of a partial recession with or without a reduction in output, the sensitivity of earnings to particularly strong business levels at the end of the year, or the breakeven point implied by a strategic plan, such as the launch of a new business venture. The breakeven point can also be presented graphically:
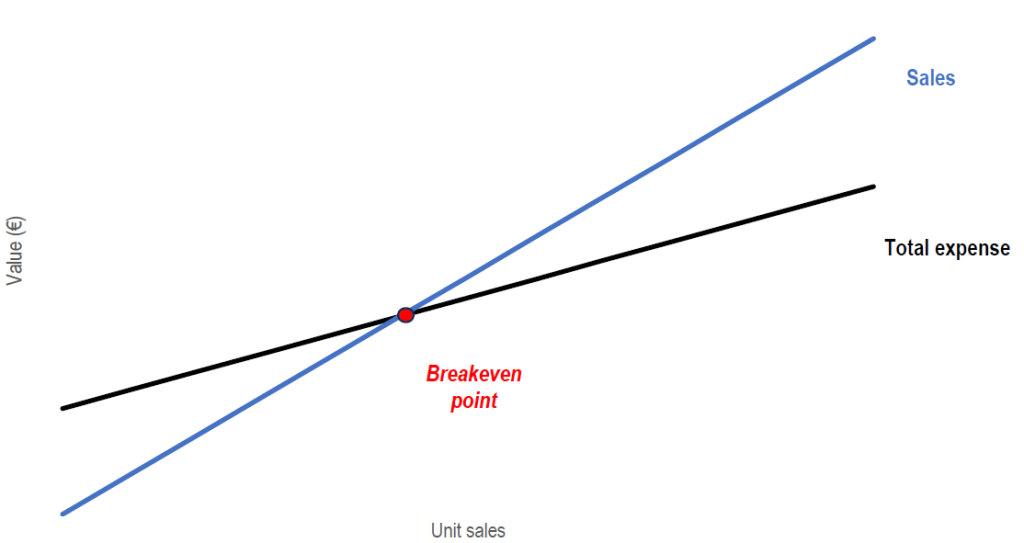
The breakeven point is the level of sales at which fixed costs are equal to the contribution margin, which is defined as the difference between sales and variable costs. At this point, the following equation holds true:
Contribution margin = Fixed costs
Or m × Sales = Fixed costs
i.e.
\[m=\frac{Sales-Variable costs}{Sales}\]where “Sales” is the level of sales at the breakeven point and “m” is the contribution margin expressed as a percentage of sales.
Types of breakeven points
The breakeven point can be calculated before or after payments to the company’s fund providers. Consequently, three different breakeven points can be determined:
- Operating breakeven, which depends on the company’s fixed and variable production costs and determines the stability of operating profit
- Financial breakeven, which considers the interest costs incurred by the company and determines the stability of profit before tax and non-recurring items
- Total breakeven, which takes into account all returns required by the company’s lenders and shareholders
Operating breakeven is a risky concept because it ignores any return on capital invested in the company, while financial breakeven understates the actual breakeven point as it does not reflect any return on equity, the basis of all value creation. Therefore, it is recommended to calculate the breakeven point at which the company can generate not zero net income but a positive net income sufficient to meet the shareholders’ required return. This requires adjusting the company’s cost base by the pre-tax profit expected by shareholders. Below this breakeven point, the company might generate a profit but will not fully meet shareholders’ profitability requirements.
Interest charges represent a fixed cost at a given level of sales (and thus capital requirement). A company experiencing significant volatility in its operating profit can partially offset this instability through modest financial expenses by pursuing a limited debt strategy. In any case, earnings instability is greater for a highly indebted company due to its financial expenses, which constitute a fixed cost.
Based on these considerations, operating leverage depends on four key parameters:
- The stability of sales, the structure of production costs, and the company’s position relative to its breakeven point, which all determine the stability of operating profit
- The level of interest expense, which is influenced by the company’s debt policy
In practice, a company is in an unstable position when its sales are less than 10% above its financial breakeven point. Sales 20% above the financial breakeven point indicate a relatively stable situation, and sales more than 20% above the financial breakeven point for a given business structure indicate an exceptional and comfortable situation. The 2008–2009 economic crisis demonstrated that being 20% above the breakeven point is not enough in some sectors, where activity can suddenly collapse by 20%, 30%, or even 40%, as seen in the cement, steel, and car industries.
2. A MORE REFINED ANALYSIS
Analysis of past situations
Breakeven analysis, also known as cost–volume–profit analysis, serves three main purposes: to analyze earnings stability considering market characteristics and production cost structure, to assess a company’s real earnings power, and to evaluate the difference between forecasts and actual performance.
In the context of earnings stability, the absolute level of the breakeven point is less significant than the company’s position relative to it. The closer a company is to its breakeven point, the greater its earnings instability. Near the breakeven point, even a small change in sales can cause a significant change in net income. Consequently, strong earnings growth may simply indicate proximity to the breakeven point. For instance, consider a company with total fixed costs of €200,000, variable costs per unit of €50, and a unit selling price of €100. Its breakeven point is 4000 units, meaning the company must sell at least 4000 units to make a profit.
We should be cautious when profits outpace sales growth for companies with narrow profit margins, as this may indicate the influence of operating leverage. Therefore, breakeven analysis provides perspective on rapid earnings growth in a strong year. Rather than solely celebrating exceptional performance, analysts should evaluate the risks of potential future profit declines.
Operating leverage, which amplifies changes in a company’s earnings in response to fluctuations in sales, underscores the need to interpret income statement-based margin analysis carefully. Exceptionally high profits might stem from temporary favorable conditions that are unlikely to persist, as seen in many companies during the year 2000. Hence, evaluating a company’s sustainable earnings power must consider both structural profitability drivers and the impact of operating leverage, along with the current phase of the economic cycle. Breakeven analysis also helps analysts understand discrepancies between a company’s budgeted and actual performance over a specific period.
Strategic analysis
- Industrial strategy: A company’s breakeven point is influenced significantly by its industrial strategy. Many companies in cyclical sectors have erred by increasing their breakeven points through heavy investment, when they should have focused on achieving lower operating leverage and a more flexible cost structure. For instance, in the construction sector, integration has often proven costly, while lean operations through outsourcing have offered survival in boom-and-bust cycles. Capital-intensive sectors like pulp and cement benefit from equity financing to mitigate the impact of sales fluctuations on profitability, contrasting with the leverage effect of debt.
- Restructuring: When a company falls below its breakeven point, it incurs losses that can only be reversed by increasing sales, lowering the breakeven point, or improving margins. Increasing sales is viable with strategic market dominance; otherwise, it can mask profitability issues and lead to cash flow problems. Lowering the breakeven point requires restructuring operations, such as modernization or capacity reductions, but can inadvertently shrink the business if not managed carefully, perpetuating a cycle of contraction.
- Analysis of cyclical risks: The breakeven point is dynamic, not static, and varies with economic cycles. A mere 5% decline in sales can amplify earnings reductions significantly beyond theoretical predictions due to price wars, delayed payments affecting fixed costs, and inventory-related expenses. Contribution margins decrease during downturns, exacerbating the breakeven point as seen in recent market examples like the Spanish property slump of 2008. Sectors with substantial production capacity, such as shipping and paper production, are prone to production imbalances where even minor volume shifts can trigger drastic price swings, underscoring the importance of competitive analysis in crisis assessment.
The concept of normative margin
Nowadays, much of the financial statement analysis focuses on preparing future financial projections based on historical data and management decisions. However, simply extrapolating past figures by applying uniform growth rates across income statement items like EBITDA or operating profit can lead to unrealistic assumptions. It’s essential for analysts to gain a deep understanding of the company, including its key drivers and profit margins. They should develop growth scenarios considering potential competitive reactions, economic conditions, and strategic policies. Analysts often use the concept of normalized earnings, aiming for sector-specific operating margins over the long term, aligning profitability with industry risks. Factors influencing these margins, such as market maturity, competition strength, brand influence, and productivity gains, must be qualitatively assessed. While this approach ensures a grounded analysis of margin dynamics, analysts must be cautious not to overemphasize future theoretical margins at the expense of current performance. Explicitly stating and validating the assumptions behind forecasts remains crucial in this process.