
In our analysis, we’ve focused on revenues and costs within a specific time frame. Now, let’s shift our
perspective to the end of the period, where we’ll analyze the remaining balances. This approach allows
us to assess net debt and accumulated wealth at a specific moment rather than over a period.
1. THE BALANCE SHEET: DEFINITIONS AND CONCEPTS
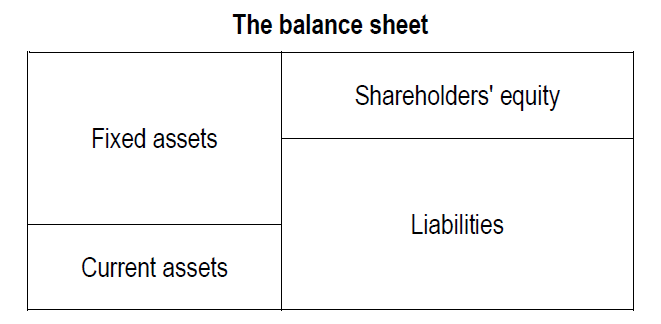
The purpose of a balance sheet is to list all the assets of a business and all of its financial resources at
a given point in time.
Main items
On the balance sheet, assets are categorized as follows:
- Fixed assets encompass all items necessary for the operating cycle that maintain value overtime, with depreciation, amortization, and impairment losses accounting for any decrease in value. These are further divided into tangible fixed assets (such as land, buildings, and machinery) and intangible fixed assets (like brands, patents, and goodwill), including long-term investments in other companies
- Inventories and trade receivables represent temporary assets formed during the operating cycle
- Marketable securities and cash, being company-owned, are also considered assets
Current assets, such as inventories, receivables, marketable securities, and cash, tend to circulate
throughout the operating cycle.
The balance sheet’s resource section includes:
- Shareholders’ equity, comprising capital from shareholders and retained earnings
- Liabilities consist of any borrowings, like bank loans or supplier credits, arranged by the business
In the framework of double-entry accounting, a company’s assets and resources must precisely
balance. This principle underpins the entire accounting system. When an item is acquired, it is either
capitalized as an asset or expensed. Capitalized items appear on the asset side of the balance sheet,
while expenses reduce earnings and subsequently shareholders’ equity. The corresponding double entry
involves either a decrease in cash (an asset) or an increase in a liability to the vendor. According
to accounting algebra, assets and resources (equity and liabilities) always have opposite signs,
ensuring the balance sheet remains in equilibrium.
Asset classification typically starts with fixed assets and ends with cash in European practice, while
North American and Japanese practice often begins with cash. Similarly, in the balance sheet’s equity
and liabilities section, Europeans typically begin with equity, whereas North Americans and Japanese
end with it.
In continental Europe, a “horizontal” format is common, with assets listed on the left and resources on
the right. In the United Kingdom, a “vertical” format is more prevalent, starting from fixed assets plus
current assets and deducting liabilities to arrive at equity. However, these are merely presentation
choices.
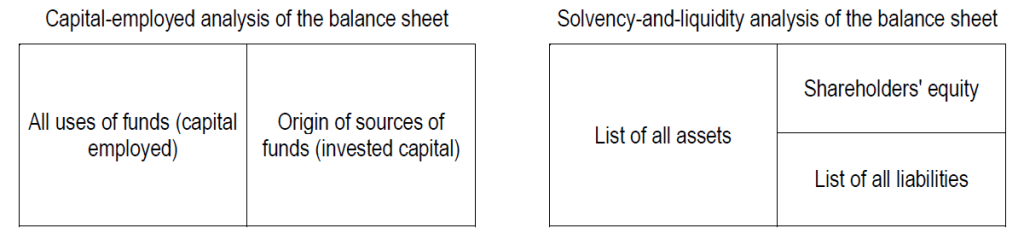
Two ways of analyzing the balance sheet
Two methods of balance sheet analysis exist: capital-employed perspective and solvency-and-liquidity
perspective.
In the capital-employed analysis, the balance sheet shows all the funds utilization for the company’s
operating cycle and traces the sources of funds. This analysis serves three primary objectives:
illustrating how a company finances its operating assets, computing the rate of return on either capital
employed or on equity, and initiating the valuation of the company’s equity as a going concern.
Conversely, in a solvency-and-liquidity analysis, a business is seen as a compilation of assets and
liabilities, with the disparity between them representing the book value of shareholder-provided equity.
This perspective involves listing all company assets and liabilities. The analysis serves three main
purposes: measuring the company’s solvency, assessing its liquidity, and providing an initial step in
valuing its equity in a bankruptcy scenario.
2. A CAPITAL-EMPLOYED ANALYSIS OF THE BALANCE SHEET
To understand the capital-employed analysis of the balance sheet well, we’ll focus on “stocks” instead
of inflows and outflows. Specifically, a capital-employed analysis divides the balance sheet into several
main sections.
Fixed assets
The fixed assets include all investments made by the business, as per our financial and accounting
definition. It’s helpful to distinguish between operating assets and non-operating assets unrelated to the
company’s main business activities, like land, buildings, and subsidiaries engaged in significantly
different industries. By isolating non-operating assets, we can assess the resources available to the
company during tough times, potentially through the sale of non-operating assets.
Working capital
The working capital represents the use of funds, including incurred but unsold operating costs
(inventories) and sales awaiting payment (trade receivables). It also covers charges incurred but not yet
paid (trade payables, social security, and tax payables), along with operating revenues from undelivered
products (advance payments on orders). The net balance of operating uses and sources of funds
constitutes working capital.
If the use of funds exceeds the sources of funds, working capital needs financing, which is more
common. Conversely, if the balance is negative, it signifies a source of funds generated by the
operating cycle, which is less frequent. Working capital is named as such because it reflects the cash
needed to cover financing shortfalls arising from day-to-day operations.
Sometimes, working capital is defined as current assets minus current liabilities, including marketable
securities, net cash, and short-term financial and banking borrowings. However, we see this definition
as improper since it mixes items from both the operating and financing cycles. Expressions like “working
capital needs” or “requirements in working capital” are synonyms for working capital. It can also be
divided into operating working capital and non-operating working capital.
Operating working capital comprises the following accounting entries:
| Inventories | Raw materials, goods for resale, products and work in progress, finished products |
| + Trade receivables | Amounts owed by customers, prepayments to suppliers and other trade receivables |
| – Trade payables | Amounts owed to trades suppliers, social security and tax payables, prepayments by customers and other trade payables |
| = Operating working capital |
Only the regular number of operating sources of funds is factored into the calculation of operating
working capital. Unusually extended payment terms granted by suppliers should not be considered part
of normal operating working capital. If such extended terms are permanent, the abnormal portion should
be treated as a source of cash, effectively making the suppliers act as the company’s bankers.
Inventories of raw materials and goods for resale should only be valued at their standard amount.
Exceptionally large inventory figures should never be included in the calculation of operating working
capital. If necessary, the excess portion of inventories or inventory held for speculative purposes can be
treated as a high-risk short-term investment.
Working capital is entirely separate from the methods used to evaluate fixed assets, depreciation,
amortization, and impairment losses on fixed assets. However, it is influenced by inventory valuation
methods, deferred income and costs (spread over one or more years), and the company’s provisioning
policy for current assets and operating liabilities and costs. While we’ve considered the timing
discrepancies between inflows and outflows during the operating cycle, we’ve always assumed that
capital expenditures are paid for upon purchase and that non-recurring costs are paid for when they are
recognized in the income statement. However, there may be timing differences, leading to what is
termed non-operating working capital.
Non-operating working capital, while not robust from a theoretical standpoint, is challenging to predict
and analyze because it depends on individual transactions, unlike operating working capital, which is
recurring.
Capital employed
Capital employed includes a company’s fixed assets and its working capital (both operating and nonoperating). It represents the net amounts allocated by a business to its operating and investing cycles
and is also referred to as operating assets. This capital is financed primarily by shareholders’ equity and
net debt, often consolidated as invested capital.
Shareholders’ equity
Shareholders’ equity consists of the initial capital contributed by shareholders during the company’s
formation and subsequent capital injections, along with earnings retained by the company and allocated
to reserves.
Net debt
The company’s gross debt encompasses all forms of debt financing, regardless of maturity, including
medium and long-term borrowings (due in more than one year) and short-term bank or financial
borrowings (due in less than one year). Net debt, on the other hand, deducts cash, equivalents (such as
petty cash and bank accounts), and marketable securities from gross debt. These deductions represent
assets that could potentially offset or entirely eliminate the gross debt, as they involve the company
lending money to banks or financial markets.
3. A SOLVENCY AND LIQUIDITY ANALYSIS OF THE BALANCE SHEET
The examination of the balance sheet from a solvency-and-liquidity viewpoint provides an overview of
the company’s assets and liabilities at the close of the fiscal year. This analysis serves various
purposes:
- Shareholders utilize it to enumerate the company’s assets and liabilities, acknowledging the potential need for revaluation of these figures
- Creditors employ it to evaluate the risk associated with extending loans to the company
In capitalist systems, shareholders’ equity serves as the ultimate guarantee in case of liquidation,
prioritizing creditor claims over those of shareholders.
Balance sheet liquidity
Prior to conducting a liquidity analysis, a systematic classification of balance sheet items is imperative.
Liabilities are arranged based on their repayment timeline, distinguishing between short-term obligations
(due in less than one year), medium to long-term liabilities (due in more than one year), and those not
yet due for repayment. Similarly, assets can be categorized by duration as follows:
- Current assets, typically expected to vanish from the balance sheet within the next year
- Fixed assets, anticipated to persist on the balance sheet beyond the upcoming year
In a liquidity assessment, liabilities are categorized by their maturity date, investments by their duration,
and assets as follows:
- Assets are considered liquid if they can be converted into cash within the normal operating cycle, typically within a year. This primarily includes inventories and trade receivables, barring unusually prolonged operating cycles
- Assets not intended for sale in the regular course of business, regardless of their type (e.g., head office, plant), are deemed fixed (non-current) and illiquid
The liquidity of a balance sheet stems from the swifter monetization of assets compared to the
repayment of liabilities. While the maturity schedule of liabilities is predetermined, the liquidity of current
assets remains uncertain due to potential sales setbacks or inventory devaluations. This contrast
between the structured maturity of liabilities and the uncertain liquidity of assets is a critical aspect.
Consequently, short-term creditors assess the gap between a company’s asset liquidity and its liability
structure, often requiring a buffer of current assets exceeding short-term liabilities to ensure safety.
Hence, the fundamental financial principle dictates that a company must maintain current assets due for
monetization within one year at least equivalent to its liabilities maturing within the same period.
Solvency
From an accounting perspective, a company may be deemed insolvent when its shareholders’ equity
becomes negative, indicating that its liabilities surpass its assets. Occasionally, solvency is interpreted
more broadly, denoting the company’s capability to settle its debts as they come due.
Net asset value
This concept focuses on solvency and aims to determine shareholders’ investments by assessing the
company’s value as the difference between its assets and liabilities. Net asset value is primarily an
accounting and, in some cases, tax-related term rather than a financial one. The book value of
shareholders’ equity is calculated as everything owned by the company minus its existing or potential
liabilities. Financial experts often refer to net asset value, which can be confusing for non-specialists,
who might interpret it as total assets minus depreciation, amortization, and impairment losses. Book
value of equity is thus equal to the sum of fixed assets and current assets minus all liabilities of any
kind.
When a company is sold, the purchaser tends to take an even more rigorous approach, which involves:
- considering contingent liabilities that aren’t listed on the balance sheet
- excluding assets that have no value, such as many intangible assets due to their accounting complexity
4. EXAMPLE OF A CAPITAL-EMPLOYED BALANCE SHEET
To highlight the different concepts of this article, here is an example of a capital-employed balance
sheet: