
Analyzing a company’s margins is crucial. A company must sell products for more than production costs to avoid failure, but positive margins alone don’t guarantee success. Operating profit (EBIT) is more emphasized than net income because it reflects true performance, while financial and non-recurring items are less critical. The first step is to assess the accounting practices used in the income statement, as companies might misclassify charges to present better operating profits. Next, conducting a trend analysis of revenues and costs over several years can help predict future performance, assuming consistent business activities. Instead of a purely descriptive approach, it’s important to evaluate the company’s strategic position and risk profile. Companies with strategic power are more profitable, so income statement analysis should prioritize qualitative assessments.
1. OPERATING PROFIT
By-nature format income statements in Continental Europe provide deeper analysis than the by-function format in Anglo-Saxon accounting. While the latter categorizes costs like sales and marketing, the former details raw material purchases and personnel costs. Analysts can find detailed information in the notes to the accounts and typically work back to EBITDA using depreciation and amortization data from the notes or cash flow statement.
Sales
Sales trends are crucial in financial analysis and company assessments. Different business activity levels-rapid growth, stagnation, slow growth, decline, or depression-lead to varied challenges. Sales growth, the foundation of financial analysis, should be examined in terms of volume, price trends, organic growth, and acquisitions. To analyze sales volumes accurately, external growth must be separated from organic growth for a like-for-like comparison. This involves assessing the company’s performance based on a consistent structure and examining additions or withdrawals from consolidation. Most groups provide pro forma accounts for comparison. For rapidly growing companies, it is essential to analyze the rise in operating costs and cash needs. In contrast, stagnant companies must reduce operating costs and financial needs. Production factors vary in flexibility depending on sales trends. For single-product companies, volume growth is the difference between overall sales increase and product price. For companies with diverse products, analysts can study main products or calculate an average price increase to estimate volume growth. Analyzing price increases helps determine the impact of inflation on sales growth by comparing the company’s prices with the sector’s general price index and considering currency fluctuations and product mix changes.
This analysis reveals the company’s strategy, such as:
- Raising prices through higher-value-added products
- Increasing prices due to uncontrolled administrative overheads
- Lowering prices to pass on efficiency gains to customers
Production
Production establishes a link between materials used in a period and the corresponding sales. This is crucial for companies with high inventory or work in progress. However, production is not fully consistent as it includes:
- Production sold, shown at the selling price
- Changes in inventories of finished goods and work in progress, stated at cost price
Therefore, production is mainly an accounting concept influenced by the methods used to value inventories. A faster growth rate in production than in sales may indicate serious issues such as:
- Overproduction, leading to the need to reduce activities and incur additional costs in the following year
- Overstatement of inventory value, which will reduce future margins
Production for own use is not problematic unless its size is relatively large. From a tax perspective, it is beneficial to minimize production for own use to maximize expensable capital expenditure. An unusually high amount may indicate underlying problems and an attempt by management to superficially boost book profit.
Gross margin
Gross margin represents the difference between production and the cost of raw materials used. It holds particular significance in industrial sectors, offering insights into a company’s strategic direction. However, distinguishing between price and volume effects is challenging due to the diverse nature of products involved. At a general level, productivity ratios for raw materials are difficult to compute accurately. Analysts often compare the growth rates of cost of sales versus net sales (for by-function income statements), or raw materials versus production (for by-nature income statements). Significant differences over time may indicate shifts in product mix or changes in the production process. Internal analysts, with access to management accounts, may calculate more precise productivity ratios based on actual raw material costs used in the operating cycle.
Gross trading profit
Gross trading profit represents the difference between the selling price of goods and their purchase cost. This metric is vital in retail, wholesale, and trading sectors, providing insights into a company’s strategic decisions. Unlike its components (sales and cost of goods sold), gross trading profit tends to be relatively stable over time.
Value-added
This represents the value added by the company through its activities to goods and services purchased from third parties. It equals gross trading profit plus gross margin used, minus other operating costs purchased from third parties. For by-nature income statements, it can be calculated as:
Value added = Gross trading profit + Gross margin − Other operating costs purchased from third parties
Other operating costs include outsourcing costs, property or equipment rentals, non-inventory raw materials and supplies (e.g., water, energy, maintenance-related items), insurance premiums, research expenses, intermediary fees, advertising, transportation, travel expenses, meeting and reception costs, postal charges, and bank fees (excluding interest on loans).
For by-function income statements, value added is calculated as:
Value added = Operating profit (EBIT) +
Depreciation, amortisation, and impairment losses on fixed assets + Personnel costs +
Tax other than corporate income tax
At the company level, value added provides insights into a company’s sector integration. Analysts often compare average value added across sectors to gauge competitiveness. Making a distinction between internal contributions and external purchases overlooks how companies tailor decisions to diverse markets (e.g., labor, raw materials, capital). Instead, companies focus on crafting specific value creation strategies to differentiate offerings from competitors and drive revenue. What truly matters is the market-based relationship between the company and its suppliers, including raw materials, capital providers, and labor. In sectors like food processing, companies establish significant ties with the farming industry, impacting broader economic dynamics. When companies establish exclusive contractual relationships with suppliers, the concept of value added can lose relevance.
Personnel cost
Personnel costs are a significant item, often proportionally high. Despite being theoretically variable, they function more as fixed costs in the short term. A thorough financial analysis should consider both volume and price effects, gauged through the personnel expense ratio, alongside employee productivity ratios such as sales, production, or value added per average headcount. External analysts typically rely on rough estimates due to limited access to detailed internal data. Productivity improvements are generally modest and diffuse across various items in the income statement, complicating precise isolation. It’s crucial for analysts to recognize the inertia of personnel costs, whether in terms of increasing or decreasing headcount. For instance, hiring 100 additional staff members throughout the year means only 50% of their salary costs impact the current year, with the full impact deferred to the subsequent period. Similarly, layoffs follow a comparable pattern.
Earnings before interest, taxes, depreciation and amortization
EBITDA (earnings before interest, taxes, depreciation, and amortization) is a vital metric in income statement analysis, distinct from macroeconomic indicators like value added and production. It directly reflects microeconomic operational performance by measuring the difference between operating revenues and cash operating charges. EBITDA is calculated as:
EBIT (Operating profit) + Depreciation, amortization, and impairment losses on fixed assets
For by-nature income statements, it can alternatively be calculated as:
Value added – Taxes (excluding income tax) – Personnel costs and payroll charges – Impairment losses on current assets and additions to provisions + Other operating revenues – Other operating costs + Depreciation, amortization, and impairment losses on fixed assets
Understanding changes in the EBITDA margin helps analysts explain shifts in company performance due to factors like production costs, personnel expenses, or pricing strategies. Maintaining a positive EBITDA margin is crucial in today’s competitive environment for businesses aiming to enhance profitability and operational efficiency.
2. THE ALLOCATION OF OPERATING PROFIT
EBIT (earnings before interest and taxes) is allocated among the various stakeholders of the company: financial earnings for lenders, net income for shareholders, and corporation tax for the government, which supports infrastructure and creates a favorable environment. Non-recurrent items also play a role in this allocation. Understanding EBIT distribution is crucial as it illustrates how company earnings contribute to stakeholders and societal benefits.
Net financial expense & income
Net financial income is an unusual concept for industrial or service companies whose primary focus is not generating financial returns. Typically, financial items should show a negative balance, reflecting finance’s role as a means to fund operational assets. However, some large corporations, particularly those with significant negative working capital like major retailers, aspire to generate net financial income through their financial activities.
Financial income encompasses various sources:
- Income from securities and loans categorized as long-term investments (fixed assets), excluding dividends and interest on loans from equity investments
- Other interest and related income from commercial and other loans, marketable securities, and miscellaneous financial sources
- Reversals of provisions and charges like impairments on financial items and financial charges
Financial expense includes:
- Interest and associated charges
- Foreign exchange losses on debt
- Net losses from the sale of marketable securities
- Amortization of bond premiums
- Provisions for financial liabilities, charges, and impairment losses on investments
Net financial expense, influenced by the company’s debt burden and prevailing interest rates, is not linked to the operational cycle and lacks volume or price effects. Also, profit before tax represents the difference between operating profit and net financial expense, serving as a critical indicator in financial analysis.
Non-recurring items
Depending on accounting principles, companies have discretion over what they include in the exceptional or extraordinary items category. The International Accounting Standards Board (IASB) now incorporates extraordinary and exceptional items within operating activities without explicit identification. Despite this approach, many IFRS-reporting companies present a “recurring operating profit” or similar metric before the operating profit line to clarify ongoing operations.
Non-recurring items, such as extraordinary items and results from discontinued operations, are typically straightforward to identify. Exceptional items pose a more complex challenge. In large corporations, activities like plant closures or restructuring provisions may occur annually across various divisions or countries, making them recurring items. Certain industries, like car rentals that regularly renew their fleets, record periodic capital gains, treating these as recurring exceptional items in their operating profit. Conversely, smaller firms often encounter exceptional items as one-off occurrences, thus classifying them as non-recurring. Assessing non-recurring items in terms of current profitability or forecasting their future trends is often impractical.
Income tax
The corporate income tax line poses challenges in analysis due to factors like deferred taxation, impacts from foreign subsidiaries, and tax-loss carryforwards. Analysts commonly calculate the group’s effective tax rate (i.e., corporate income tax divided by profit before tax) to gauge the company’s tax management performance over time. A low effective tax rate requires scrutiny, potentially stemming from the utilization of tax-loss carryforwards or aggressive tax planning strategies, which can carry risks, especially in high-debt or deficit environments. In the financial statements’ notes, a table often provides a reconciliation between the theoretical corporate tax rate and the actual tax rate paid by the company or group (commonly known as the “tax proof”).
3. FINANCIAL ASSESSMENT
The scissors effect
The scissors effect stems from a straightforward phenomenon where revenues and costs move in divergent directions. This dynamic directly influences profits and margins. For instance, if revenues grow by 5% annually but certain costs escalate at a faster pace, earnings naturally decline. If unchecked, this trend leads to successive annual profit reductions, eventually resulting in losses, a scenario known as the scissors effect. Identifying the scissors effect is less crucial than understanding its underlying causes. Various factors can trigger this phenomenon, such as regulatory changes, fierce competition, or strategic missteps within a sector. These factors reflect the company’s strategic position in its market. Strong companies can often offset cost increases by raising prices, thus expanding margins.
Conversely, the scissors effect can erode profits due to:
- Regulatory constraints that prevent price increases, thereby squeezing margins
- Reluctance to adjust prices, as observed during periods of economic volatility
- Weak cost management, where rising costs outpace the ability to pass them on through higher prices, stifling growth while costs continue to escalate
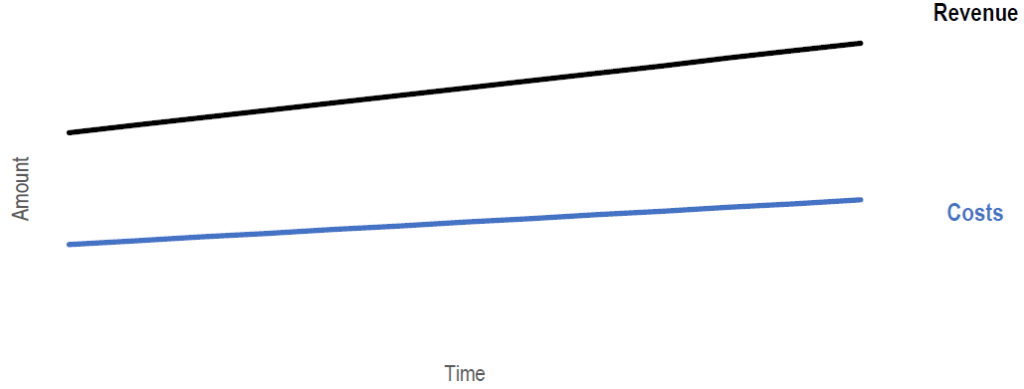
The impact of production cost trends is pivotal, given their substantial role in product pricing. Analysts must gauge how delays in price adjustments could impact profitability, influenced by market dynamics and competitive strengths. However, the scissors effect can also work favorably for companies, as illustrated in subsequent charts.
From carelessness:
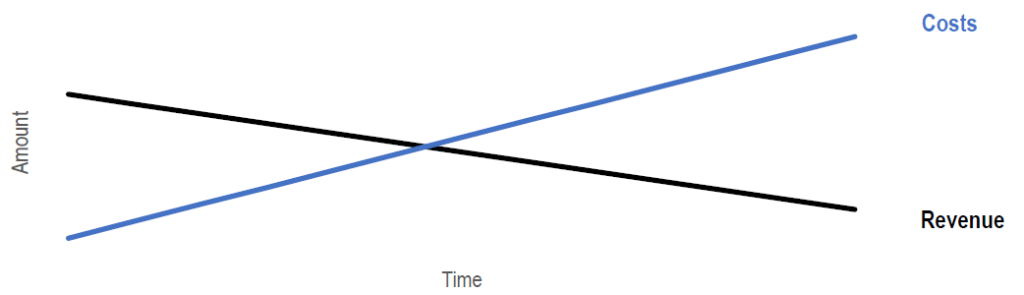
To excellence:
The pitfall
A company’s financial statements are filled with potential pitfalls that require careful navigation to avoid misinterpretations during analysis.
- The Stability Principle suggests that a company’s earnings are often more resilient than assumed, such as in cases where net income closely tracks net financial income in a supermarket chain
- Regulatory Changes imposed by governments, like currency devaluations or restrictions on operating hours, can disrupt business operations
- External Factors specific to the industry, such as market pressures or new competitors, significantly influence a company’s performance
- Pre-emptive Action involves adjusting prices proactively in response to anticipated cost increases, seen in industries like champagne following grape price hikes
- Inertia Effects in competitive sectors may delay passing cost increases to customers, impacting profitability
- Inflation Effects incentivize overinvestment and inventory accumulation to capitalize on inflated prices, potentially distorting financial results
- Capital Expenditure and Restructuring efforts initially strain profitability due to upfront costs and operational adjustments
Navigating these complexities requires understanding nuanced responses within competitive environments rather than relying on simplistic correlations.