
So far, the analysis has covered how a company creates wealth through margin analysis, the necessary investments like capital expenditure and increases in working capital, and how these investments are financed through debt or equity. With these elements in place, assessing the company’s efficiency, specifically its profitability, becomes possible. A company that delivers returns at least equal to those required by its shareholders and lenders will not face long-term financing problems, as it will be able to repay its debts and create value for its shareholders. This underscores the importance of measuring a company’s book profitability, ensuring it meets expectations and secures financial stability and growth potential.
1. ANALYSIS OF PROFITABILITY
Measuring profitability requires analyzing returns in relation to invested capital, as profitability is non-existent without investment. Book profitability is the ratio of wealth created (earnings) to the capital invested, distinguishing it from margins, which are the ratio of earnings to business volumes (sales or production). Profitability, on the other hand, is the ratio of profits to the capital required to generate those profits. Analysts should prioritize the profitability of capital employed by examining the ratio of operating profit to capital employed, known as return on capital employed (ROCE).
\[𝑅𝑒𝑡𝑢𝑟𝑛\ 𝑜𝑛\ 𝑐𝑎𝑝𝑖𝑡𝑎𝑙\ 𝑒𝑚𝑝𝑙𝑜𝑦𝑒𝑑\ (𝑅𝑂𝐶𝐸)=\frac{𝑂𝑝𝑒𝑟𝑎𝑡𝑖𝑛𝑔\ 𝑝𝑟𝑜𝑓𝑖𝑡 \times (1−𝑐𝑜𝑟𝑝𝑜𝑟𝑎𝑡𝑒\ 𝑖𝑛𝑐𝑜𝑚𝑒\ 𝑡𝑎𝑥\ 𝑟𝑎𝑡𝑒)}{𝐶𝑎𝑝𝑖𝑡𝑎𝑙 𝑒𝑚𝑝𝑙𝑜𝑦𝑒𝑑}\]Return on capital employed can be equated to return on equity if net debt is zero. The debate over using opening, closing, or average capital employed figures remains unresolved, but consistency in the chosen method is crucial for accurate long-term comparisons. The appropriate operating profit figure is the one calculated after employee profit-sharing, incentive payments, and all other operating cycle revenues and charges. These figures should be calculated after tax using the normal tax rate rather than actual income tax, which includes financial interest deductions. Analysts must decide whether to work on an after-tax basis as suggested here. If so, they need to calculate operating profit after theoretical tax (based on the company’s normalized tax rate), known as NOPAT (net operating profit after tax).
ROCE can be determined by combining a margin and turnover rate, providing a comprehensive measure of profitability.
\[\frac{𝑂𝑝𝑒𝑟𝑎𝑡𝑖𝑛𝑔\ 𝑝𝑟𝑜𝑓𝑖𝑡\ 𝑎𝑓𝑡𝑒𝑟\ 𝑡𝑎𝑥}{𝐶𝑎𝑝𝑖𝑡𝑎𝑙\ 𝑒𝑚𝑝𝑙𝑜𝑦𝑒𝑑}=\frac{𝑂𝑝𝑒𝑟𝑎𝑡𝑖𝑛𝑔\ 𝑝𝑟𝑜𝑓𝑖𝑡\ 𝑎𝑓𝑡𝑒𝑟\ 𝑡𝑎𝑥}{Sales}\times\frac{𝑆𝑎𝑙𝑒𝑠}{𝐶𝑎𝑝𝑖𝑡𝑎𝑙\ 𝑒𝑚𝑝𝑙𝑜𝑦𝑒𝑑}\]The first ratio – operating profit after tax/sales – corresponds to the company’s operating margin, while the second – sales/capital employed – reflects asset turnover or capital turn, indicating the capital needed to generate sales. Consequently, a “normal” return on capital employed can result from weak margins but high asset turnover (low capital intensity), as seen in mass retailing, or high margins but low asset turnover (high capital intensity), like in satellite operations. ROCE can be dissected into its components, revealing different business models. Some companies achieve similar ROCE through different strategies: one might have a strong operating margin but weak asset turnover due to high fixed assets, while another has a smaller operating margin but higher asset turnover with minimal inventories. Return on equity (ROE), the ratio of net income to shareholders’ equity, is also crucial. Analysts often exclude goodwill impairment losses and non-recurring items from net income before calculating ROE to better reflect ongoing business performance.
2. LEVERAGE EFFECT
General principle
The leverage effect links a company’s return on equity (ROE) to its return on capital employed and the cost of debt. In our analysis, capital employed encompasses both equity and debt invested in assets aimed at generating earnings.
All the capital contributed by lenders and shareholders is utilized to fund the company’s capital employed, which in turn supports its operational activities and generates operating profit. This profit is then allocated between paying net financial expenses to debt holders and distributing net income to shareholders. When comparing a company’s return on equity with its return on capital employed (after tax for consistency), any disparity arises primarily from its financial structure, excluding non-recurring items and specific consolidated account adjustments addressed separately. The leverage effect elucidates how debt financing enables a company to achieve a return on equity that exceeds its return on capital employed by leveraging the difference between the two, thus enhancing shareholder returns. However, it’s important to acknowledge that the leverage effect operates bidirectionally; it can enhance returns during favorable conditions but also pose risks during downturns or adverse financial circumstances.
The equation
Before proceeding, it’s essential to understand the impact of taxation on financial analysis. Taxes reduce earnings, with all revenues subject to taxation and expenses potentially reducing the overall tax burden (assuming profitability). Therefore, every line item in the income statement contributes either to tax expense or a theoretical tax credit, resulting in the net tax payable amount. To calculate operating profit after tax, one simply multiplies the operating profit before tax by a factor of (1 – corporate income tax rate).
Therefore, we ensure the consistency of our calculations by maintaining an after-tax basis for key profit indicators throughout this chapter. This approach applies equally whether we consider operating profit, net financial expenses, or net income.
Moving forward, let’s encapsulate our findings in an equation: Net income equals the return on capital employed multiplied by shareholders’ equity, adjusted by the surplus or deficit resulting from net debt. This surplus or deficit is determined by multiplying net debt by the difference between after-tax return on capital employed and after-tax cost of debt. To express this formula in terms of profitability rather than earnings, we derive the following equation:
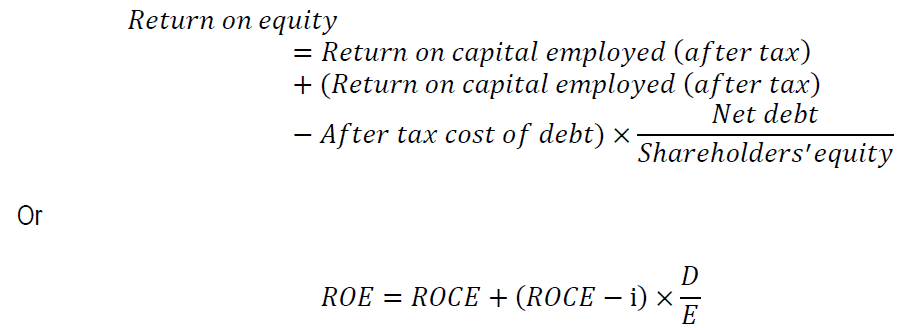
The ratio of net debt to shareholders’ equity represents financial leverage or gearing. Therefore, the leverage effect can be articulated as follows:
𝑁𝑒𝑡 𝑑𝑒𝑏𝑡 / 𝑆ℎ𝑎𝑟𝑒ℎ𝑜𝑙𝑑𝑒𝑟𝑠′𝑒𝑞𝑢𝑖𝑡𝑦 =(𝑅𝑒𝑡𝑢𝑟𝑛 𝑜𝑛 𝑐𝑎𝑝𝑖𝑡𝑎𝑙 𝑒𝑚𝑝𝑙𝑜𝑦𝑒𝑑 − 𝐴𝑓𝑡𝑒𝑟 𝑡𝑎𝑥 𝑐𝑜𝑠𝑡 𝑜𝑓 𝑑𝑒𝑏𝑡)
The leverage effect remains relevant even in scenarios where a company holds negative net debt, meaning its short-term financial investments surpass its debt value. In these instances, return on equity is balanced as an average between return on equity and return on short-term investments, weighted by shareholders’ equity and short-term investments. Consequently, the leverage effect can be computed similarly, substituting the after-tax rate of return on short-term financial investments, which often exhibits a negative value due to the negative net debt.
Calculating the leverage effect
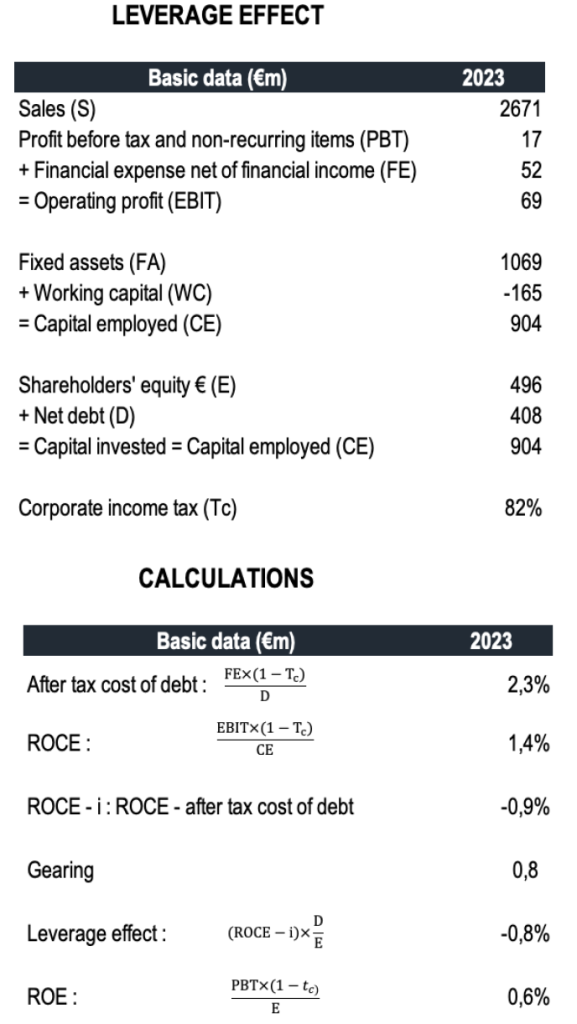
To compute the leverage effect and return on equity, the following data from the income statement and balance sheet will help:
From the income statement:
- Sales (S)
- Profit before tax and non-recurring items (PBT)
- Net financial expenses (FE)
- Operating profit (EBIT)
From the balance sheet:
- Fixed assets (FA)
- Working capital (WC), including both operating and non-operating components
- Capital employed (CE), which is the sum of fixed assets and working capital, alternatively financed by shareholders’ equity and debt
- Shareholders’ equity (E)
- Net debt, encompassing short-, medium-, and long-term bank borrowings and debt minus marketable securities, cash, and equivalents (D)
As readers calculate return on equity, regardless of the method chosen, consistency in results is ensured. Using profit before tax and excluding non-recurring items helps eliminate their impact on calculations. While Account analysis and accounting items addressed quasi-equity distinctions and provisions between working capital and debt, two practical challenges arise in consolidated financial statements: handling goodwill and associate companies. Goodwill treatment, detailed in Financial consolidation, significantly influences outcomes. When impairment tests result in offsetting goodwill against shareholders’ equity, substantial portions of capital employed and shareholders’ equity can vanish from the balance sheet. This may artificially inflate nominal returns on equity and capital employed, as substantial amounts of capital seem to disappear under accounting standards. However, shareholders’ return expectations remain unchanged, reflecting their normal rate of return requirements on the capital, irrespective of its accounting treatment.
Therefore, we suggest that analysts should ideally work with gross goodwill figures whenever feasible, adjusting shareholders’ equity by adding the difference between gross and net goodwill to maintain balance in the balance sheet. Similarly, it is advisable to base calculations on operating profit and net profit before goodwill amortization or impairment losses. Losses carried forward, although not reflected on the balance sheet, should be considered separately, as they do not contribute to shareholders’ equity recovery.
In consolidated accounts, the treatment of income from associates presents another challenge. Should income from associates be categorized as financial income or part of operating profit? Considering it as financial income aligns with scenarios where a financial group may sell investments to reduce debt. Conversely, treating it as part of operating profit relates to industrial groups where such income stems from investments included in capital employed, albeit typically intended as temporary exceptions rather than a strategic focus.
Negative capital employed
Companies experiencing negative capital employed often exhibit extensive negative working capital that surpasses their net fixed assets. This trend is prevalent in specific sectors like contract catering and retailing, where such companies frequently report notably high return on equity figures. Among the dual roles played by shareholders’ equity-financing capital expenditure and serving as collateral for lenders-companies with negative capital employed typically do not necessitate the former. Instead, shareholders’ equity primarily functions as a guarantee for creditors.
Therefore, when calculating return on capital employed in these scenarios, it becomes essential to incorporate income generated from short-term financial investments, which is included in earnings, along with the magnitude of these investments included in capital employed.
\[𝑅𝑂𝐶𝐸=\frac{(𝐸𝐵𝐼𝑇+𝐹𝑖𝑛𝑎𝑛𝑐𝑖𝑎𝑙\ 𝑖𝑛𝑐𝑜𝑚𝑒) \times (1−𝑇𝑐)}{𝐶𝑎𝑝𝑖𝑡𝑎𝑙\ 𝑒𝑚𝑝𝑙𝑜𝑦𝑒𝑑 + 𝑆ℎ𝑜𝑟𝑡\ 𝑡𝑒𝑟𝑚\ 𝑓𝑖𝑛𝑎𝑛𝑐𝑖𝑎𝑙\ 𝑖𝑛𝑣𝑒𝑠𝑡𝑚𝑒𝑛𝑡𝑠}\]In such cases, companies integrate their financial income into the pricing of their products and services. Therefore, excluding short-term financial investments from the calculation of capital employed would be nonsensical.
3. LEVERAGE EFFECT LIMITATIONS
The book profitability indicators limits
Book-based return on capital employed figures are vital for financial analysis but have limited practical financial implications. The leverage effect equation remains robust despite anomalies in metrics such as debt costs relative to net financial expenses and balance sheet debt, which often
result from varying debt levels or seasonal fluctuations. Efforts to address these challenges involve using averaged or adjusted figures for fixed assets and shareholders’ equity, primarily feasible for internal analysts with comprehensive data access. Caution is advised against overreliance on atypical implicit interest rates or leverage effects.
For business managers and profit centers, return on capital employed is crucial for assessing performance and profitability, especially with the emergence of economic profit indicators comparing returns against weighted average capital costs. However, from a financial standpoint, relying solely on book-based returns on capital employed and equity has limited merit. These metrics, derived from accounting records, do not fully reflect underlying risks and should not drive strategic decisions independently. Enhancing book returns on equity through leveraging the balance sheet can obscure a company’s true risk profile, not fully captured in accounting metrics. Therefore, historical indicators like return on capital employed and return on equity are inadequate for forecasting future shareholder or creditor return expectations.
When a company achieves high book profitability, shareholder expectations for returns tend to decrease, leading to higher market valuations of equity over book value. Conversely, low book profitability may heighten shareholder expectations, causing market valuations to fall below book value.
Growth-drive leverage strategy
Characteristic of past decades or present-day business strategies, a “forge ahead” approach thrives during periods of robust growth. This strategy combines high capital expenditure to expand industrial capacities with low margins to capture market share and optimize facility utilization. Despite yielding low return on capital employed due to these dynamics, leveraging debt—necessary when cash flows from low margins can’t fully fund high capex—enhances return on equity through the leverage effect. Additionally, during periods of inflation, debt can have a low or negative real cost, benefiting shareholders. However, such strategies can lead to volatile return on equity, especially if growth rates decline abruptly.
The leverage effect clarifies the components of return on equity, distinguishing between operational profitability and the impact of financial structure. Long-term sustainability of return on equity hinges on achieving consistent improvements in return on capital employed, reflecting operational effectiveness over financial engineering. While the leverage effect highlights how return on equity is influenced by a company’s operational and financial strategies, its value is limited in finance except in specific scenarios. For instance, during periods of inflation, negative real interest rates benefit shareholders at the expense of creditors. Alternatively, in heavily leveraged situations like leveraged buyouts (LBOs), effective performance is crucial to generate adequate cash flow for servicing substantial debt obligations, motivating strong management focus.